In Part 1 of this blog series (read here), we explored the effect of the “deficit model” on New Mexico students, teachers, and communities and how funders and nonprofits might reframe our thinking and funding strategies around the assets that already exist in the state. Today we’ll turn to the role of data in constructing narratives about education and shaping educational policy.
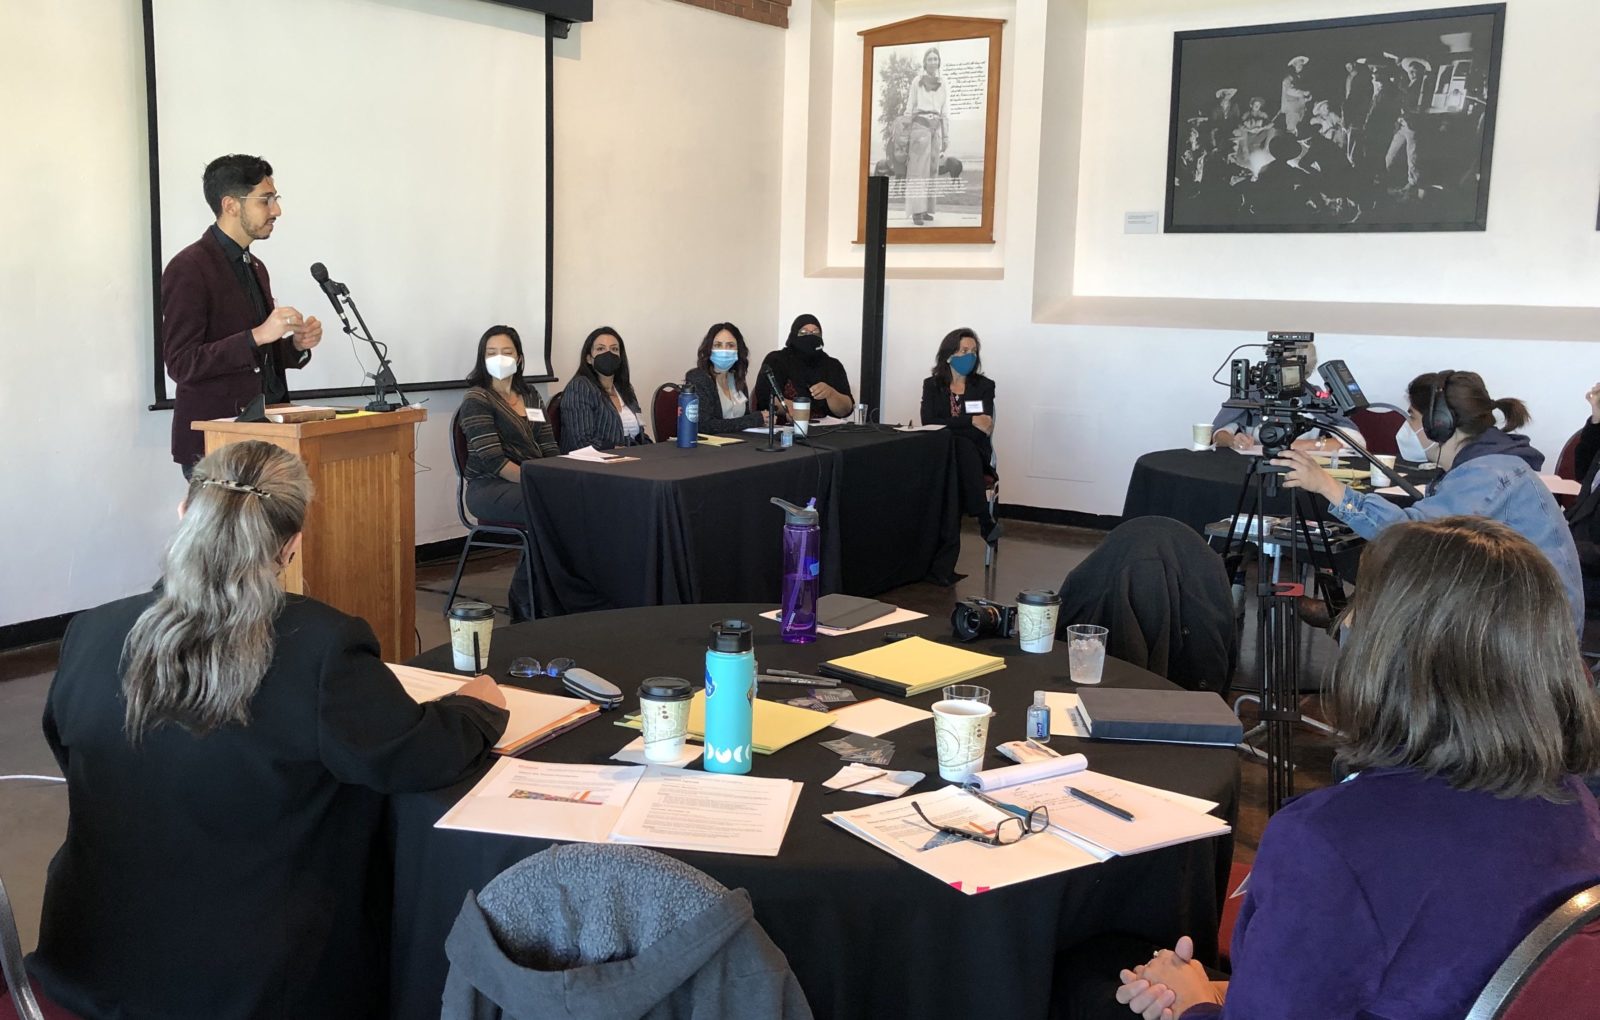
Throughout this post, we’ll be referring to the panelists who presented at the 2021 Carl & Marilynn Thoma New Mexico Education Funders Southern Summit. To learn more about this convening, please refer to the introductory post for this blog series. To find out about our panelists and facilitators, reference the bios presented here.
As our panelists at the Southern Summit discussed the role of data in their work, three themes and related questions coalesced:
- Type & Access: What kind of educational data are we collecting and who has access to it?
- Use & Bias: How are we using the data that we are collecting? What metrics or statistics give us the most accurate or complete view of education? How can we reduce bias and increase transparency, especially with aggregate rankings?
- Reimagining Data: How can we be more creative with how we use data? How can data complement the individual stories and community engagement work that many of our panelists are doing?
Type & Access
New Mexico is the last state in the U.S. without a statewide longitudinal data platform to track educational statistics. Longitudinal data systems track various measurements of a subject regularly over time, such as the grades of a group of students throughout their education. A robust system that tracks many student characteristics over a long time can provide a richer picture of student trajectories, from which we can understand how certain interventions changed those trajectories and therefore had an impact on student outcomes, or which variables interact to form different student trajectories. Fortunately, this critical work is now underway, thanks to the Research Informing Success in Education NM, a four-way partnership comprised of the NM Early Childhood Education & Care Department, the NM Public Education Department, the NM Higher Education Department, and the NM Department of Workforce Solutions.
In New Mexico, lack of access to high-quality longitudinal data has hampered the work of many of our nonprofit leaders. Hope Morales, Executive Director of Teach Plus New Mexico described the difficulty of conducting research on student and teacher demographics, and how Teach Plus’s advocacy informed the features and content of the new NM Vistas website:
“We are a majority minority state but the demographics of our teachers don’t match that of our students. When we [at Teach Plus New Mexico] were searching for data just to better understand it, we couldn’t find it. It wasn’t out there. We had to do info requests from the state and really dig deep just to learn more about our own population. Based on our reports and recommendations whenever the state rolled out the new NM Vistas data website, you can now see the student and teacher demographics by school, district, and state, and that was because of our teacher voice and advocacy. It’s important that those decision-makers are also part of it, and looking at the policies, systems, levers, and implementation that we can help that to change, too.”
Given the lack of statewide longitudinal data, community collaboration and partners at research universities have been critical in helping many of our panelists to collect and analyze the data they need to track their progress and create accountability internally, with the communities they serve, and with funders.
A key organization facilitating this work in Doña Ana County is the Center for Community Analysis (CCA) at NMSU, headed by Erica Surova. We were honored to include Surova as one of our Educational Stakeholders panelists at the Southern Summit. CCA’s analytic work has highlighted the measurable impacts of widespread nonprofit collaboration in Doña Ana County, and many of the organizations featured at the Summit partner with CCA to track their key performance indicators. Ngage New Mexico, for example, has relied heavily on CCA to monitor the effects of the SUCCESS Partnership on early childhood education in the county. As the SUCCESS Partnership expands to encompass the entire prenatal through career trajectory, they will continue to rely on CCA’s data and modeling to gauge the strengths and gaps of their collective impact program.
For the benefit of the Southern Summit attendees, Surova and researcher Hallie Keller pulled data to better illustrate the educational landscape across southern New Mexico, with particular emphasis on Doña Ana County. Having this set of well-curated, visualized data as a starting point for the conversation provided a common ground for our conversation and led to more informed discussions throughout the convening. Download a pdf the CCA’s Southern Summit info sheet by clicking the button below.
The work of community-embedded, public-facing research hubs like CCA in concert with the forthcoming RISE NM platform have the potential to revolutionize the way that educational data is collected, analyzed, and made readily accessible to a variety of stakeholders in New Mexico.
CCA Snapshot of Southern New Mexico November 2021
Use & Bias
For New Mexico, dismal aggregate rankings have been a major contributor to the dominance and persistence of the deficit model that we discussed in Part 1 of this series. Browse the U.S. News & World Report State Education Rankings or other popular ranking sites such as WalletHub and it is easy to feel a creeping sense of despair about the state’s educational prospects. According to these sites, NM mostly ranks 48th, 49th, or 50th in educational quality in the United States across a variety of metrics.
These aggregated metrics tell one story, but if we look at the data in a different way, or weight the variables differently, the story can change quite dramatically. The libertarian Cato Institute looked at the U.S. News and most other state education rankings and found a significant amount of bias, from mistakenly including educational inputs in their rankings of educational outputs, to failing to account for student heterogeneity across states. To counteract this bias, the institute created “a new ranking of state education systems using demographically disaggregated achievement data and excluding less informative factors that are not directly related to learning. Using our methodology changes the order of state rankings considerably. Many states in New England and the Upper Midwest fall in the rankings, whereas many states in the South and Southwest score much higher‐than they do in conventional rankings.”
Additionally, the Institute investigated how efficiently states spent money on education: “In these efficiency rankings, achieving successful outcomes while economizing on education expenditures is considered better than doing so through lavish spending. These efficiency rankings cause a further increase in the rankings of southern and western states and a decline in the rankings of northern states.”
New Mexico shoots up the rankings when the data is weighted a bit differently rather than simply aggregated (#42 from #50), and especially when efficiency is considered (#27). Looking at the data in this way reveals the ways in which states like New Mexico are proficient at doing more with less.
Along similar lines, several of our panelists spoke to the tendency to draw conclusions from incomplete data, or to rely too heavily on certain numbers and statistics. Dr. Mónica Torres, President of Doña Ana Community College cautioned, “When we look at the state of education, we always look at data like graduation rates or reading. And that’s important information. But when I hear the things that [fellow panelist] Lucía [Carmona] is saying, and read about what Dulcinea [Lara] studies, if we start the story back at what people are told when they are children, what they believe about themselves, what they believe about the institutions they’re attending, what their parents believe, it’s a different story about the status of education in New Mexico. I do believe the way that Erica [Surova] and Tim [Hand] think about data and the way that we talk about it in this community actually gets at some of those stories and gives us a different picture of education in New Mexico.” Dr. Torres warned against “The Danger of a Single Story,” drawing from Chimamanda Ngozi Adichie’s 2009 TED Talk of the same name. In this talk, the Nigerian storyteller and author advises against buying into a single dominant narrative about a place or a people: “The consequence of the single story is this: it robs people of dignity. It makes our recognition of our equal humanity difficult. It emphasizes how we are different rather than how we are similar.”
While data deployed simplistically can certainly rob students, schools, and communities of their nuance and humanity, at the same time, we also heard that in some cases statistics like graduation rates can provide clear and effective benchmarks to help assess large-scale collective impact efforts, such as those undertaken by the SUCCESS Partnership or The Bridge of Southern New Mexico. Tracey Bryan, outgoing Executive Director of The Bridge recounted, “We had a conversation within our Chamber of Commerce where we were looking at the fact that among the business community less than half of our students were finishing high school in 2007, and they were asking, ‘where’s our workforce coming from?’…Everyone took responsibility and many of you know that we have some of the highest graduation rates in the state now. But that’s because everybody understood they had a role to play.”
Understanding what aggregate data and rankings are telling us beneath the noise, and how educational statistics are useful and in what circumstances, is helping us to be better informed and deliberate funders as we expand our education grant-making initiatives.
Reimagining Data
Taken as a whole, our learnings from the Southern Summit emphasized the need for philanthropists who work in education to match rigorous, substantive data with local, on-the-ground observations that can only come from leaders who are deeply embedded within their communities.
For example, Daisy Maldonado, Director of the Empowerment Congress of Doña Ana County, pointed to the mismatch between available jobs in southern New Mexico and the fact that criminal justice is the number one major pursued at NMSU: “I saw this last night [on the data sheet that Erica Surova compiled] that in terms of the degrees sought at NMSU and DACC… the number one degree at NMSU is Criminal Justice. What does that mean for our community? Where are young people graduating with a Criminal Justice degree working and why is that the first option? My experience being on high school campuses is that there are border patrol recruiters, there are police recruiters, and law enforcement. Working in criminal justice is sensationalized but we have a lot of young people coming out of the school with that degree as opposed to knowledge and a degree that could get them a job in the area.” It was only Maldonado’s knowledge of the community and her experience going onto high school campuses informed her. Without this context, it is unlikely that our grants team or other funders would have been able to look at this data and understand the underlying local factors.
As funders, we often ask to see measurable impacts from our grantees. This discussion at the Summit was a reminder that it is important that collecting the data should be part of the community work nonprofit leaders and educators are already doing, not a separate activity divorced from it.
Finally, our panelists also pointed to quality data presented effectively as a tool that can bridge the gap between philanthropy serving to pilot initiatives and the state or federal government stepping into sustain them. Tracey Bryan explained: “At the Bridge, I tell people all the time that our job is to partner, to pilot, to prove it, and then to pass it to somebody to sustain it. The Early College High School, as just an example, it’s part of Las Cruces Public Schools; they fund it; the Bridge doesn’t fund it. We just looked at the data for a really long time and promoted the fact that it was working really well. That’s an example of how policy is sustaining an intervention. In a way it’s holding us to account, and in another way it’s [funders] setting the stage for using this as your learning laboratory to test out your own theories.”
The idea that “philanthropy should pilot but the state must sustain” will come up again in Part 3, where we’ll explore some of the emerging best practices in education philanthropy and how our nonprofit panelists frame the ideal funder-grantee relationship.
Sarah Rovang and Christine Dong